


How to index data into Elasticsearch from Confluent Cloud


Share on Twitter


Share on LinkedIn


Share on Facebook


Share by email


Print
This blog will guide you through the step-by-step configuration to integrate Elastic Cloud and Confluent Cloud. This integration allows data streams from Kafka topics to Elasticsearch® indices via the Elastic Sink Connector, all managed via UI and with no code required.
End-to-end capabilities: from ingest to search
Many customers are adopting Confluent Cloud and Elastic® together for a seamless and powerful data management and analytics solution. By combining the strengths of both platforms, businesses can unlock unprecedented capabilities. Confluent Cloud, with its robust event-streaming platform, provides real-time data ingestion, streaming and processing capabilities that enable businesses to react swiftly to changing conditions and make data-driven decisions. Meanwhile, Elastic — renowned for its powerful search and analytics functionalities — empowers users to explore and extract insights from vast amounts of data with lightning-fast search speeds.
Together, these technologies offer a comprehensive end-to-end solution for ingesting, processing, and analyzing data at scale and in real time. This powerful integration not only enhances operational efficiency, but also enables businesses to gain actionable value from their data, driving innovation and delivering exceptional customer experiences.
Elastic has just joined the Connect with Confluent Partner Program! Now, your data streams are available directly within Elasticsearch to accelerate the development of real-time applications.
The Elasticsearch Service Sink Connector
Elasticsearch comes with hundreds of connectors and ways of ingesting data from multiple data sources, in multiple event-driven architectures or applications. But also Kafka is the cornerstone of message handling and distribution among multiple diverse systems.
For this reason, Confluent Cloud is the perfect match to expand Elastic’s ingestion capabilities on enterprise data streams and this is made simple by the Elasticsearch Service Sink Connector. This integration is available for both your managed and self-managed workloads. Let’s get started and see how easy it is!
Generating mock messages in a topic
As a first step let’s publish sample data to a newly created Kafka topic that we’ll later read using the Elasticsearch Service Sink Connector. The easiest way to accomplish this is using the Datagen Source Connector — a tool that generates messages with a few clicks from the UI.
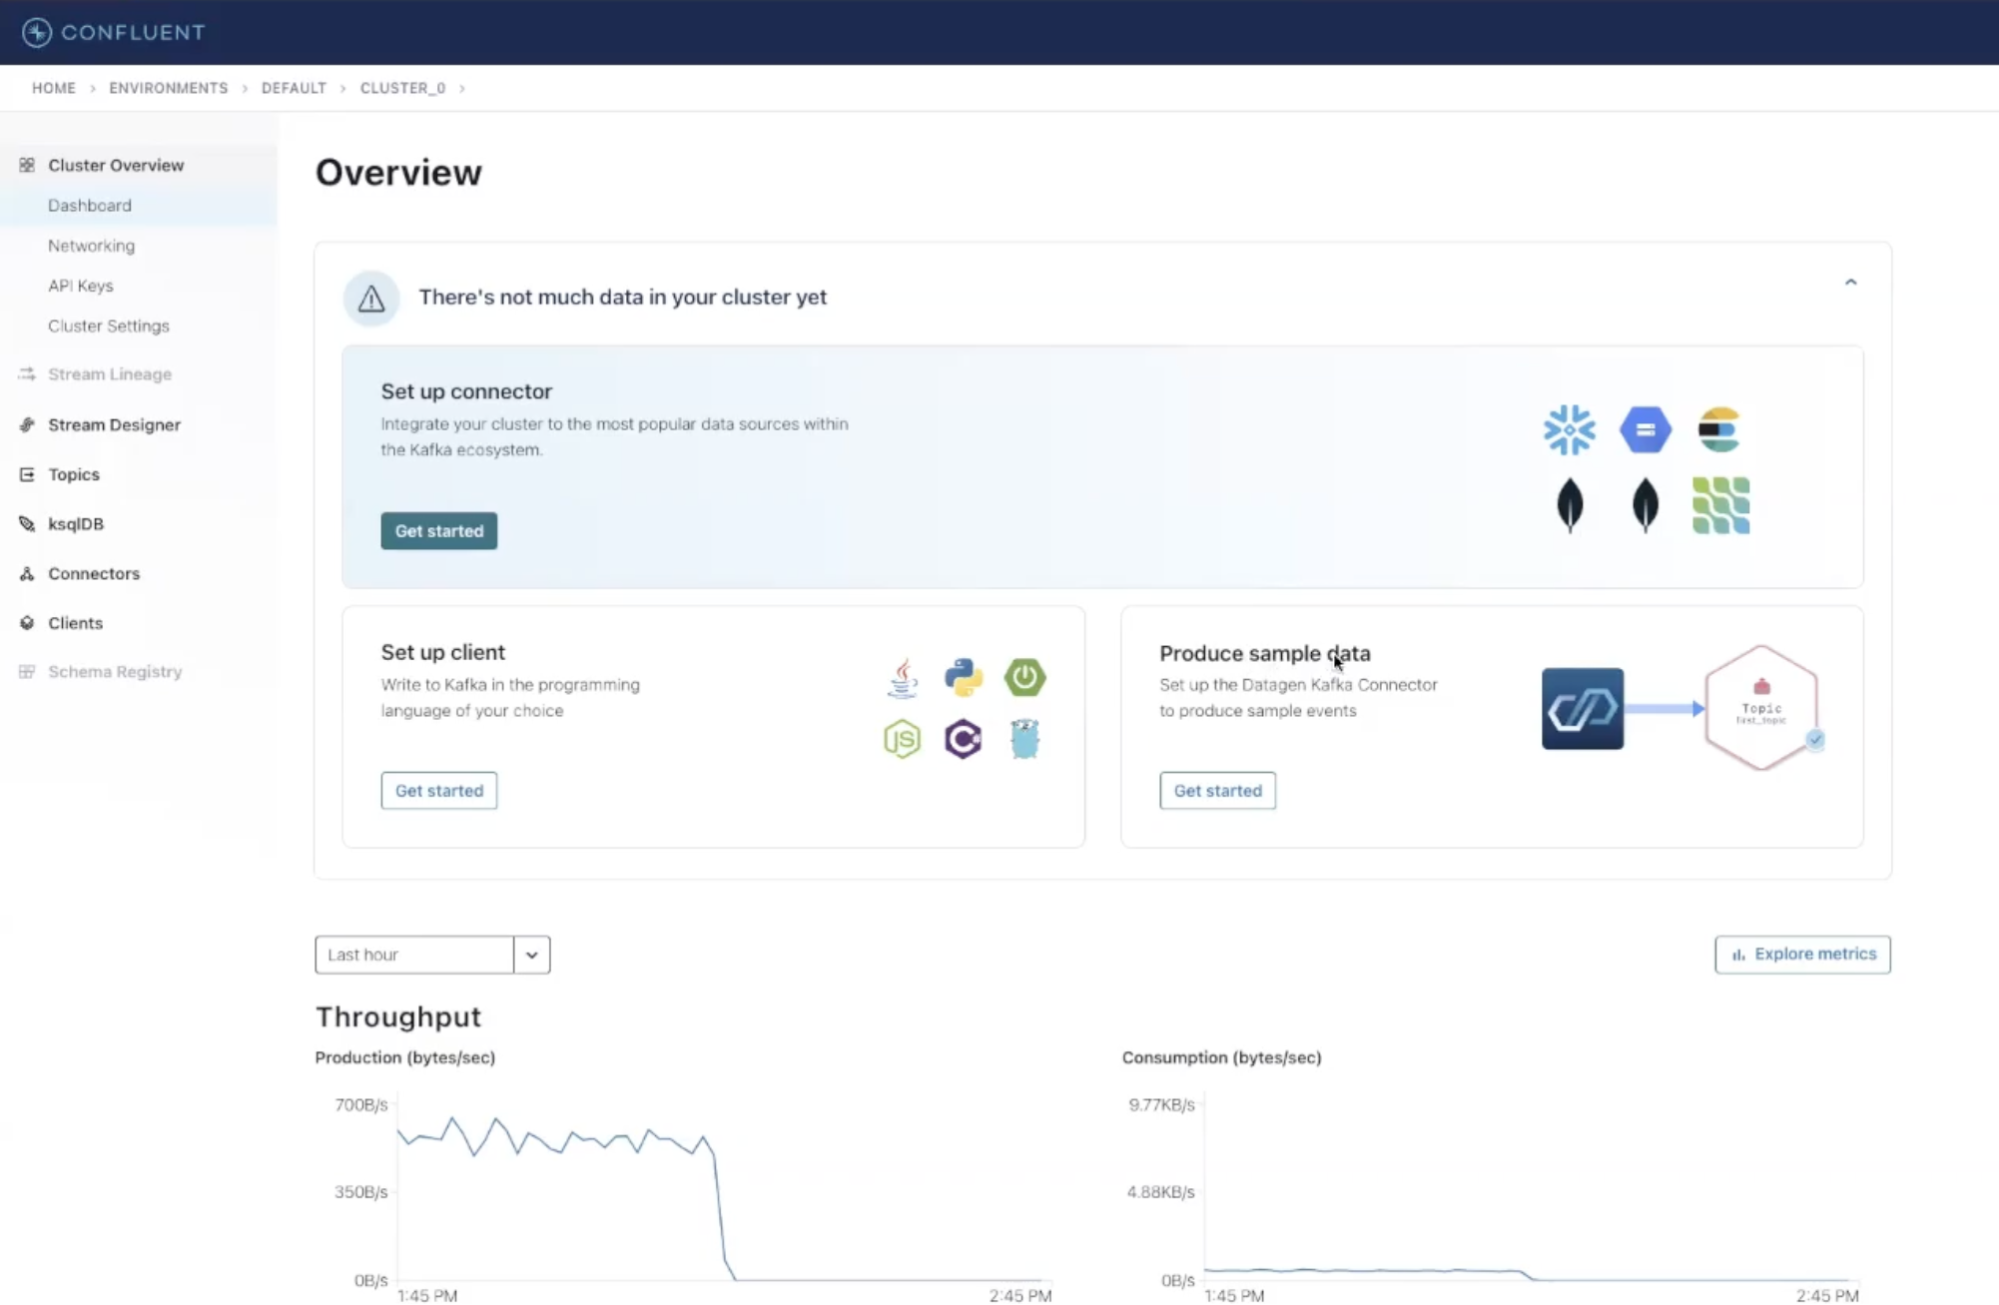
From the Confluent Cloud’s dashboard overview click on Get Started within the Produce Sample Data panel to start the process (this can also be done from the Connectors side menu). On the next screen, you’ll be asked to select a topic to send that data to. Let’s create a new topic with the Create New Topic button at the top right corner — give it a name and proceed with Create with Default.
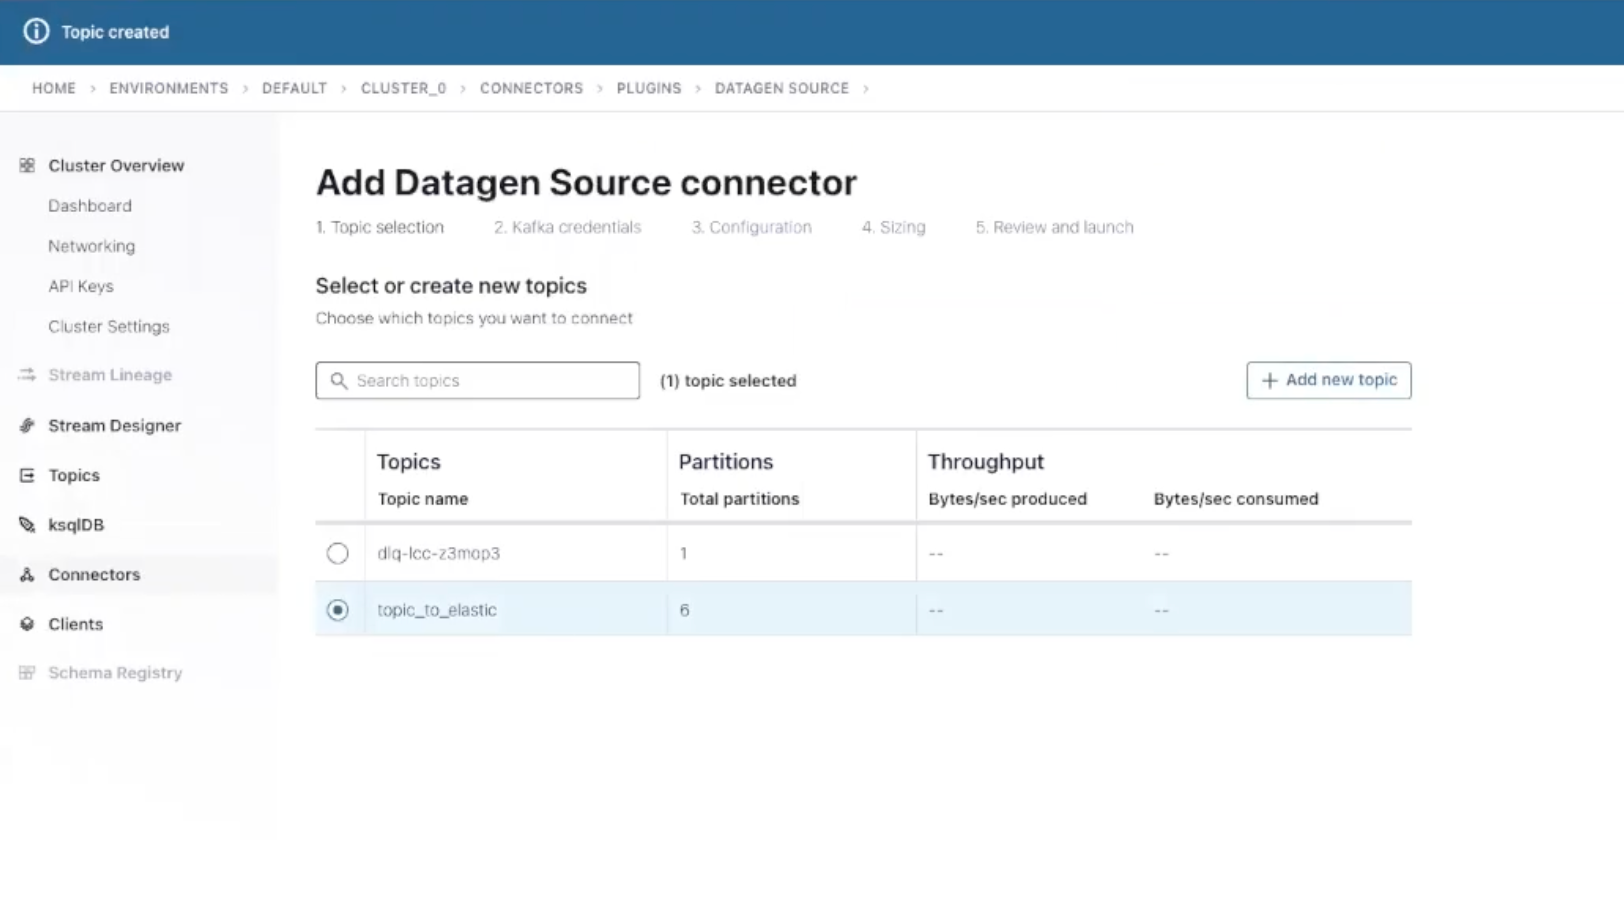
Next, select your newly created topic and Continue. You will now be required to create an API key to make your connector work with your cluster. Click on Generate API key & download, save it locally and click Continue.
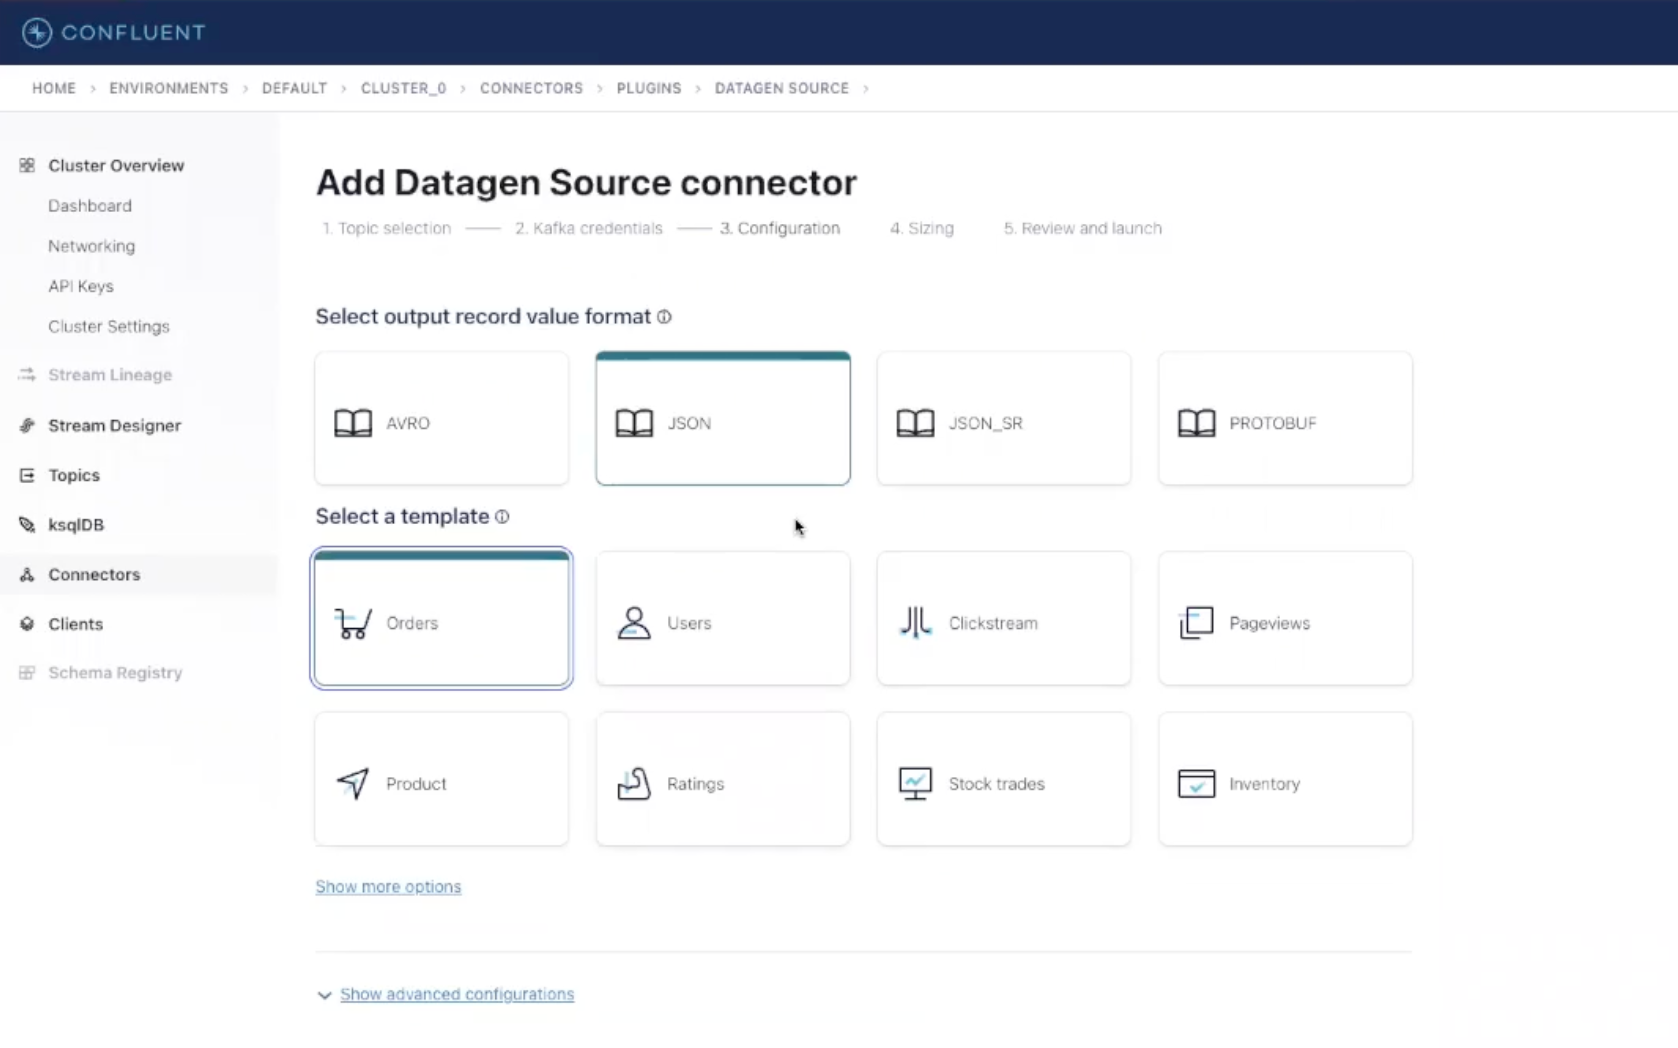
The Datagen connector gives you several choices of output types. Let’s select the JSON format and the Orders template to produce a data stream of fake sales orders in JSON format that we will later analyze via Elastic.
Continue with the default settings in the next section (4. Sizing) and go to the last review page to provide a name for your connector. Then, check the configuration, and launch the connector by clicking Continue.
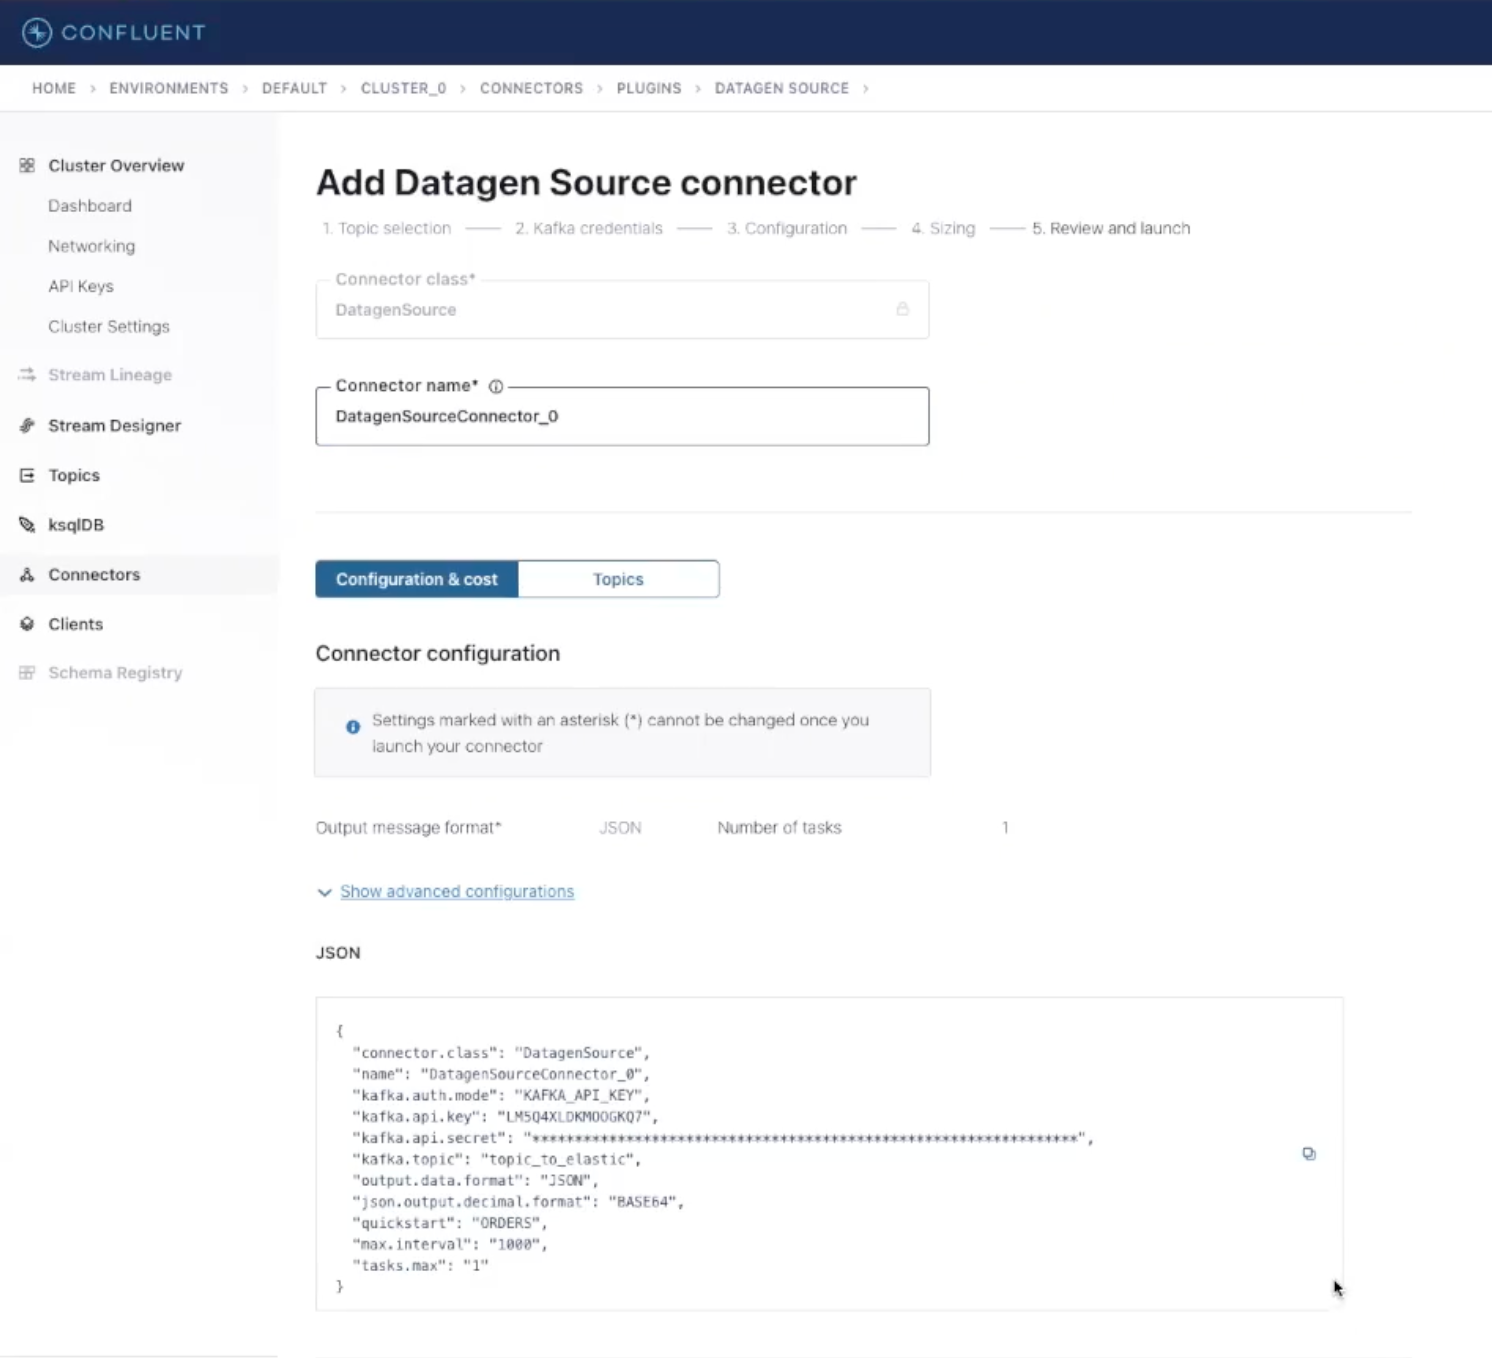
Our Datagen connector will start delivering messages after a few seconds to the specified topic and we can finally proceed to configure our Elasticsearch Service Sink Connector to move those into Elastic Cloud.
Ingesting data into Elastic Cloud
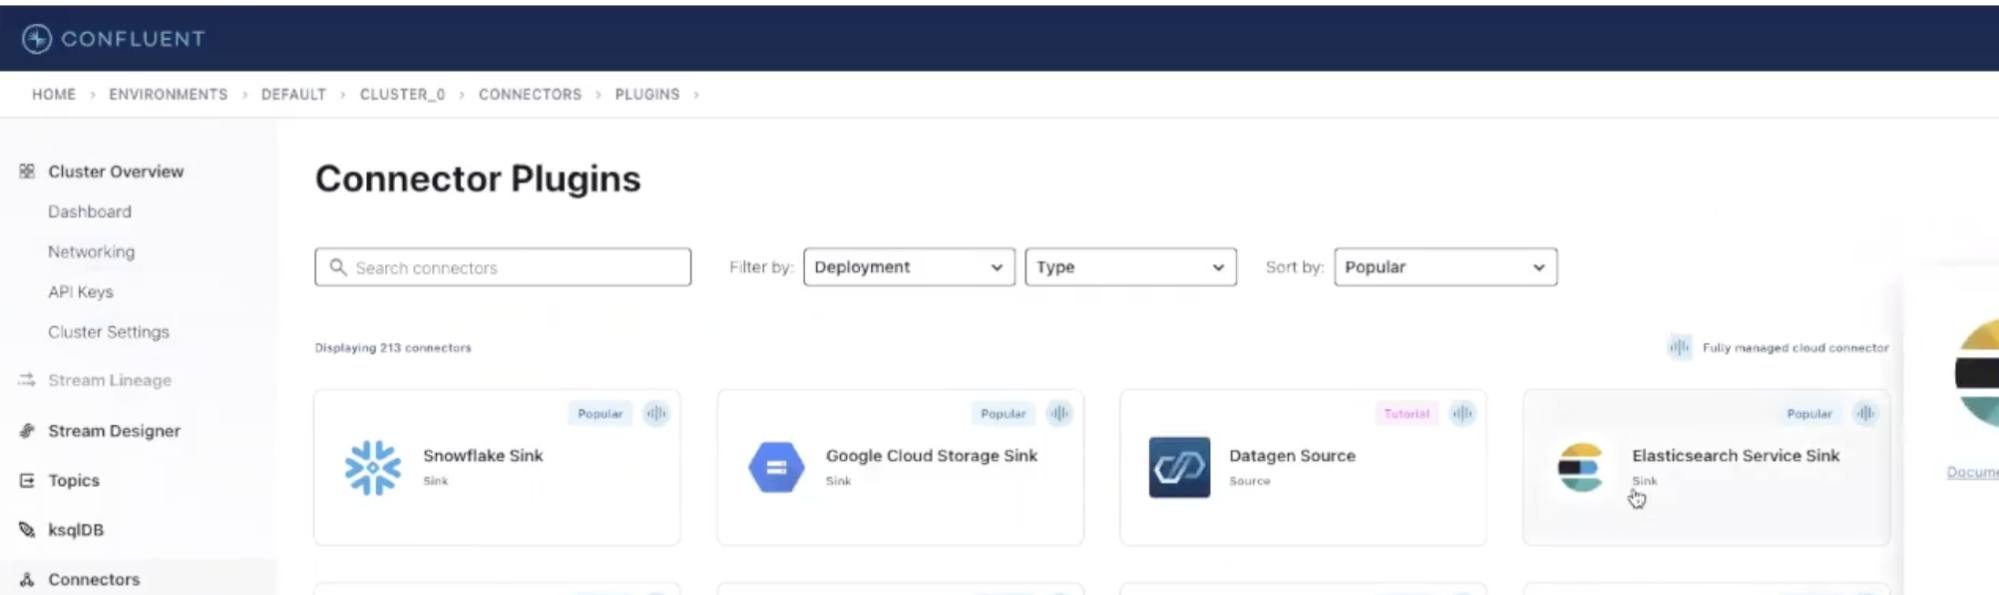
To configure our connector click on the Connectors item in the Confluent Cloud’s sidebar and select the Elasticsearch Service Sink from the list. In the next screen, you can specify the topic where the connector will read from. Let’s select the one we created previously, where Datagen is sending mock events and proceed.
From here, you’ll need to create or reuse an API key for this new connector. Generate the key, and continue to the next screen — this is where the magic happens.
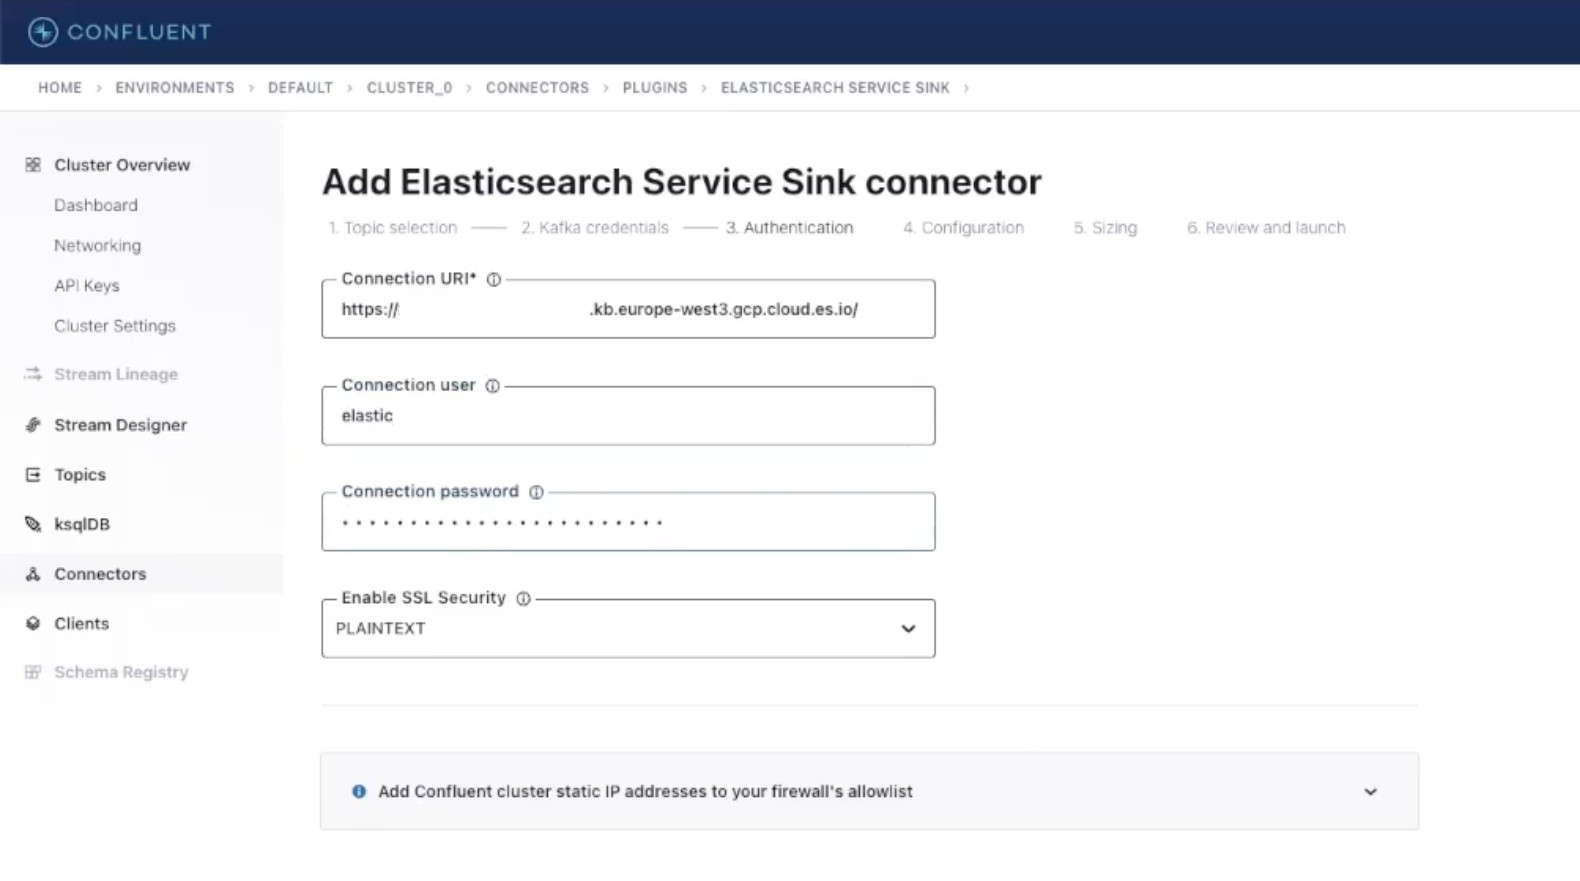
In the Authentication section, provide your Elasticsearch deployment URI and a connection user with its related password. Leave the other settings as they are and Continue.
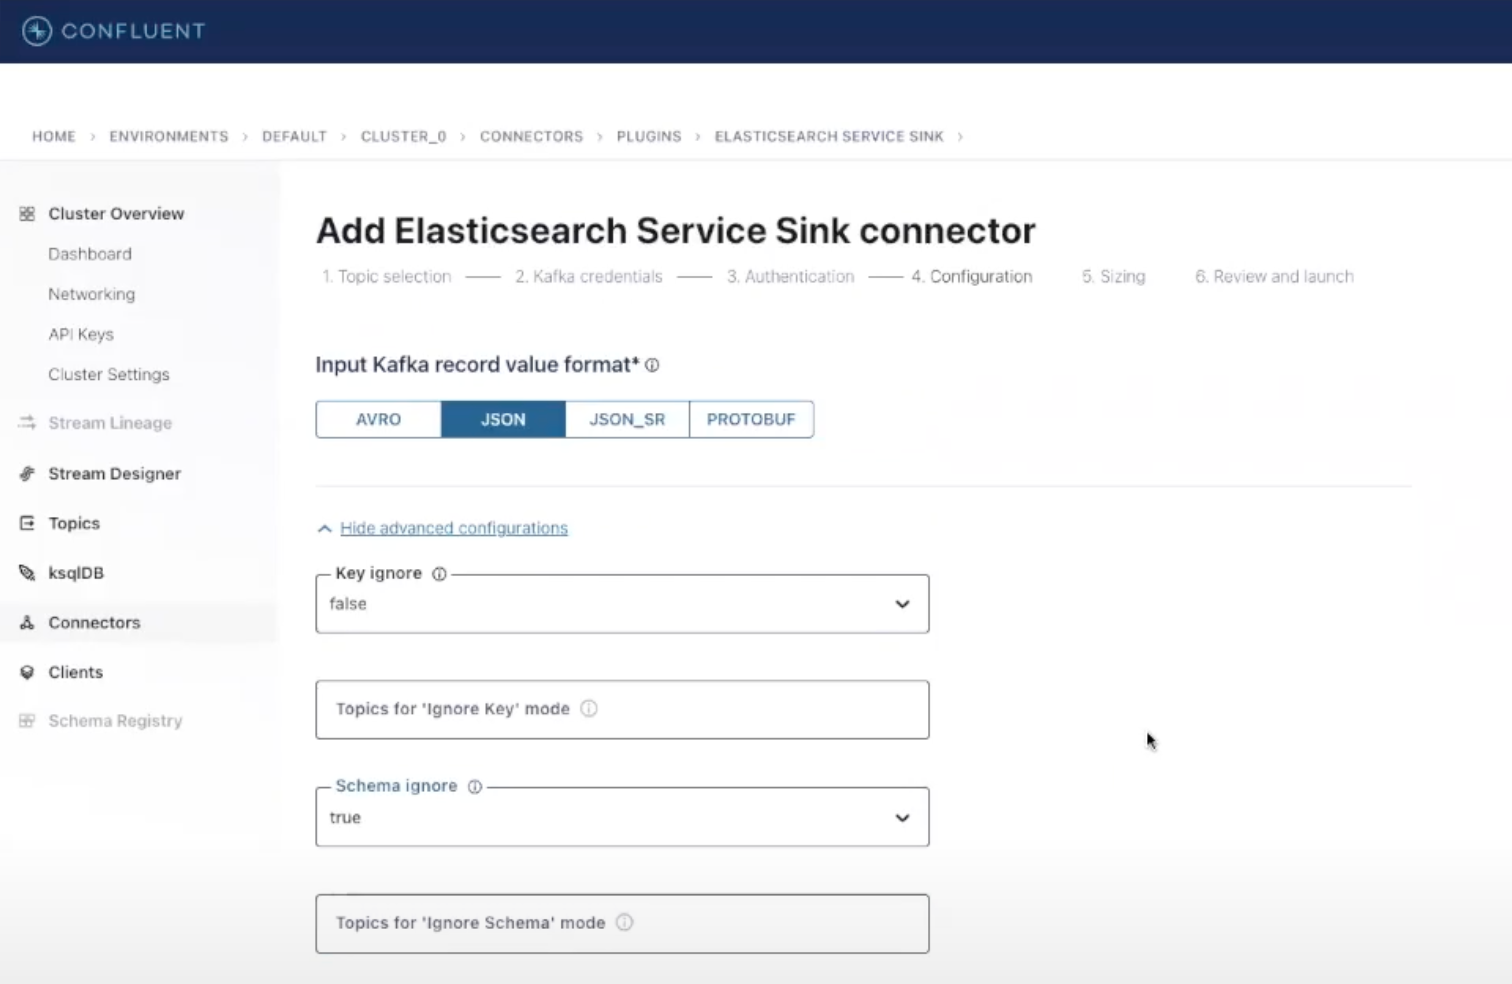
Let’s fill in a few more settings in the Configuration section: select JSON as input Kafka record value format, and in Advanced Configurations, set Schema ignore to true. This will let Elasticsearch infer mappings dynamically at indexing time.
After clicking Continue, leave all the other settings as they are. Review the configurations, and launch the Elasticsearch Service Sink Connector. Everything is now up and running, and you’ll be able to start searching your data through the powerful Kibana® features!
Search and visualize your events
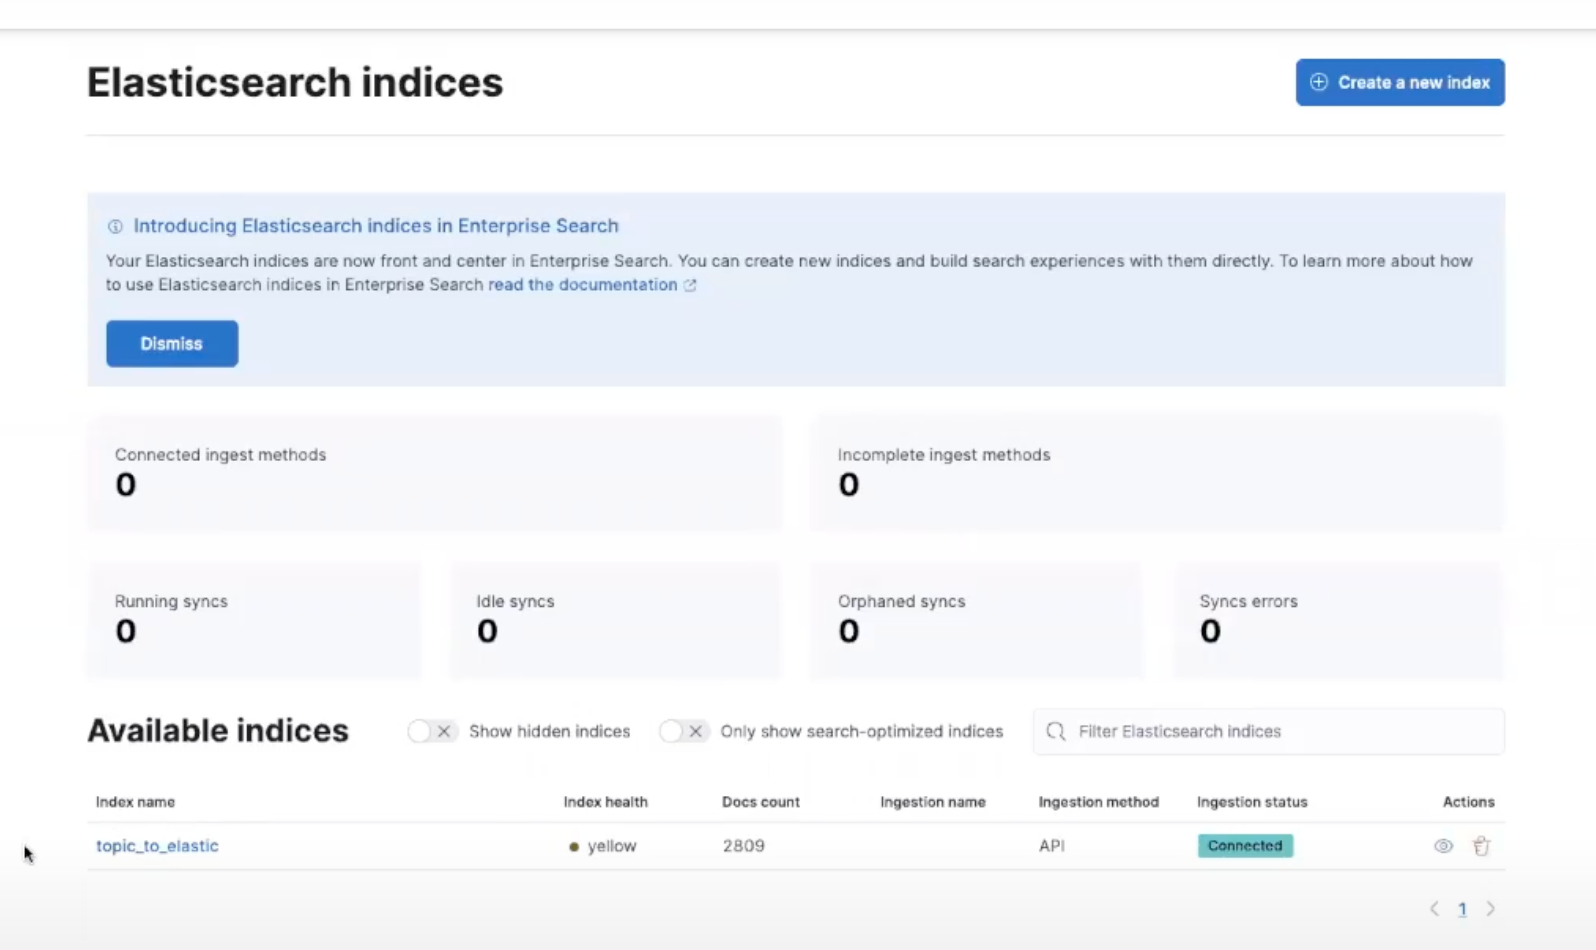
Once your connectors have started, you will see messages flowing through both of them. You can see the details by clicking on each connector and exploring metrics on total messages processed, messages/sec ratio, byte throughput and more. To check if our orders are being indexed correctly into Elasticsearch, log in to Kibana and enter the Content -> Indices section of the Enterprise Search menu, where you’ll see a new index with the same name as your Kafka topic with its related document count. This will continue to increase as long as the connectors are running. You can also see a preview and browse the documents that have been indexed by clicking on the index name and selecting the Documents tab.
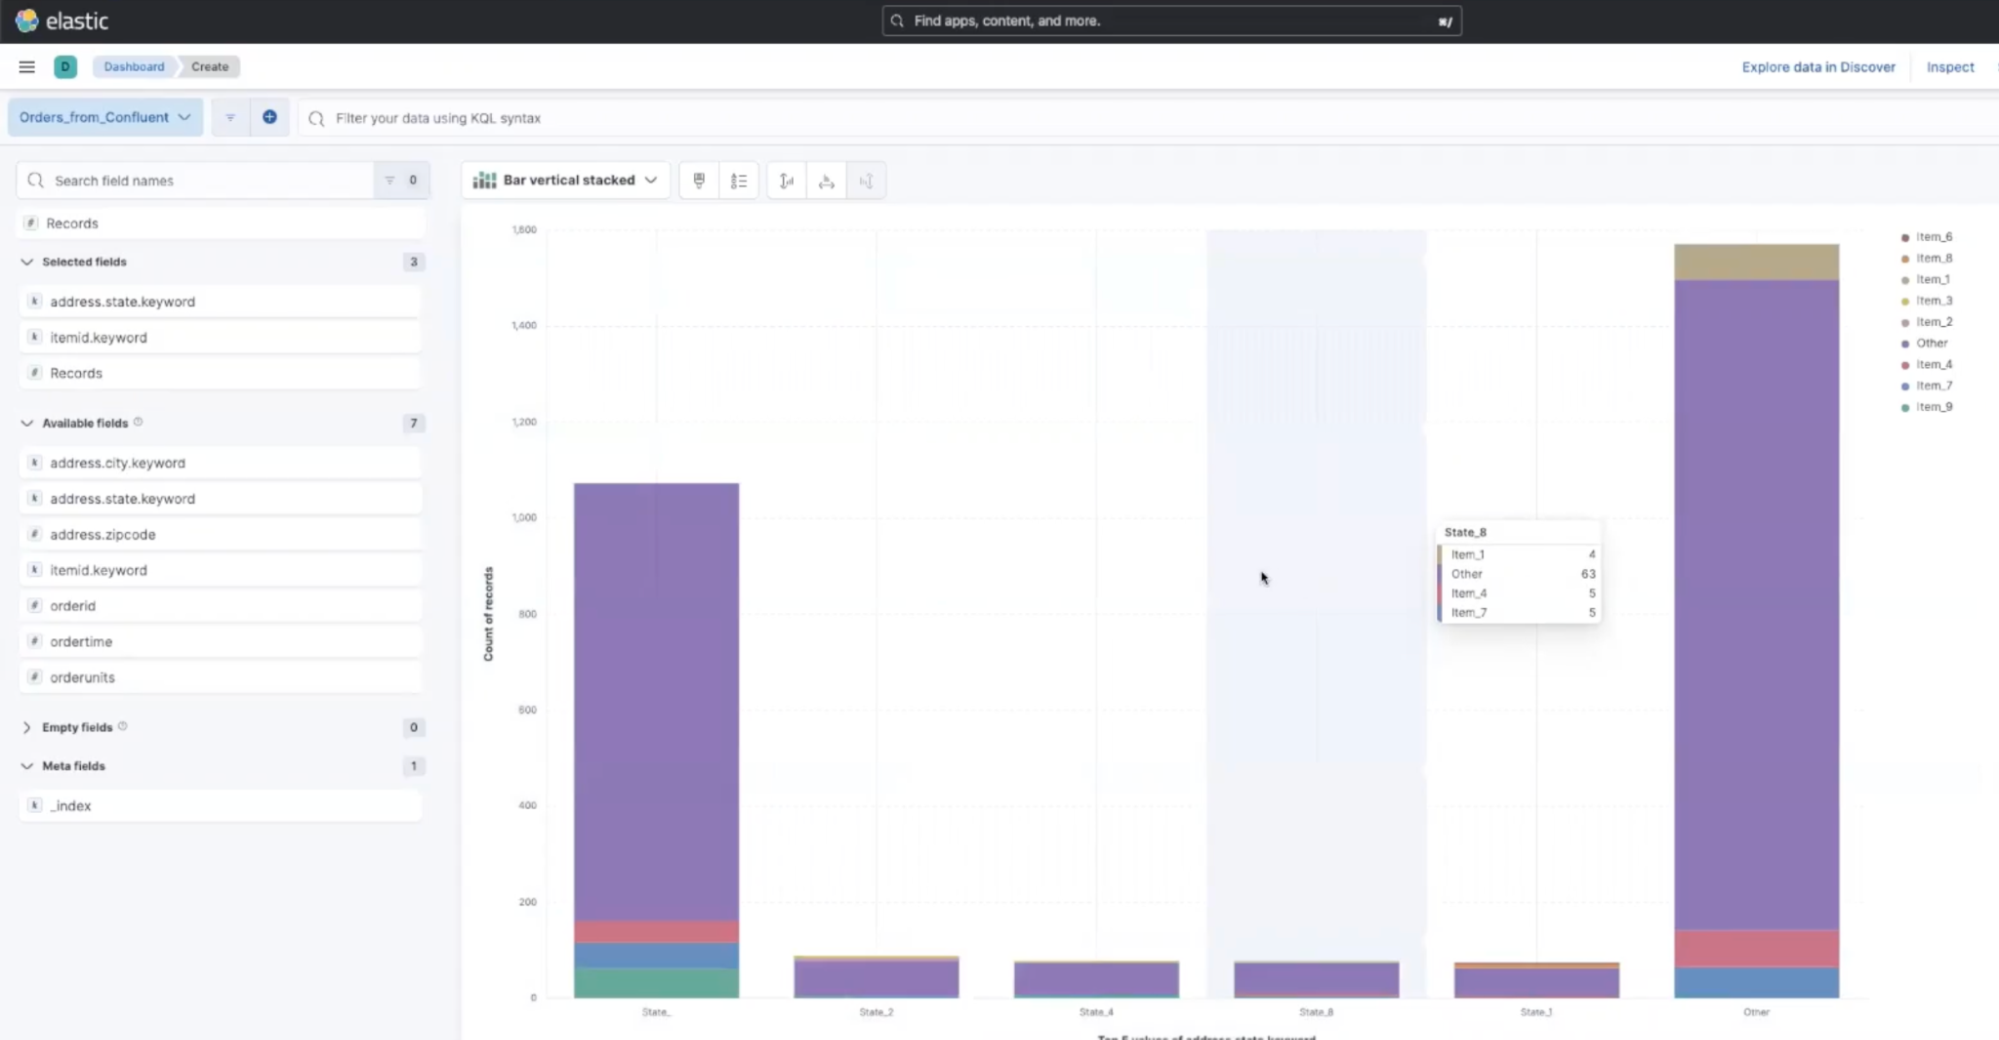
Now, it’s time to create our dashboard and start getting value out of our data. From the side bar, under the Analytics section click on Dashboard, then use the Create Visualization button to generate your first chart from a large selection. One example is selecting the Bar Vertical Stacked option from the dropdown menu and dragging and dropping your desired fields, such as itemid and address.state, from the left side panel. This will allow you to visualize items sold in each state, and you can begin exploring your data on your own!
Conclusions
We’ve seen how easy it is to combine Confluent Cloud data pipelines with Elasticsearch’s search and analytics features to enable end-to-end visibility across all of your enterprise data via the Elasticsearch Service Sink Connector. Check out our 7-minute tutorial for a detailed walkthrough, or explore more Observability use cases.
Try this out yourself! One of the easiest ways to get started and explore our capabilities is with your own free Elastic Cloud trial and Confluent Cloud trial environment, or subscribe through your favorite hyperscaler’s marketplace.
The release and timing of any features or functionality described in this post remain at Elastic's sole discretion. Any features or functionality not currently available may not be delivered on time or at all.
Elastic, Elasticsearch and associated marks are trademarks, logos or registered trademarks of Elasticsearch N.V. in the United States and other countries. All other company and product names are trademarks, logos or registered trademarks of their respective owners.
Share
Share on Twitter
Share on LinkedIn
Share on Facebook
Share by email
Print

